Every September, in brokers' offices across Kathmandu, someone says it: the market falls into Dashain. The story is always the same. Households need cash for the festival, so they sell. Banks need cash, so they stop lending to margin traders. The index slides until the exchange shuts. This week, an independent data study put 21 years of NEPSE history through a proper test and returned three answers: the fall is real, the story behind it does not fit the data, and this year is the exception.
The study was published this week by Nepalytix, and the method is the first thing to respect. Dashain moves. Ghatasthapana, the festival's first day, has fallen anywhere from September 19 (2009) to October 17 (2020), so averaging September returns across years mixes pre-festival weeks, holiday closures and recoveries in different proportions each time. The study lines every year up on Ghatasthapana instead and counts 20 trading sessions back from it, the same move an equity analyst makes when studying share prices around results announcements. The event dates were checked against the exchange's own holiday closures, so a wrong date would have shown up. None did.
The result is hard to wave away. In 16 of the 21 festivals from 2005 to 2025, the index stood lower at Ghatasthapana than 20 sessions earlier. One of those was a coin landing on its edge, a 0.01% fall in 2013. Counted honestly: 15 clear declines, one tie, five rises. Across every 20-session stretch since 2005, the index fell 47% of the time, so 16 declines in 21 tries is far off the base rate; the study puts the odds of that happening by chance at about one in 75. The two largest falls, 18.1% in 2008 and 12.1% in 2009, do not drive the finding either. Both came in the long slide after the 2007-08 peak, and without them the newer half of the record is even more consistent: in the ten festivals from 2016 to 2025, the run-up fell nine times, with 2018 the lone exception at plus 0.6%.
Where the weakness lands is the part that breaks the folk story. Measured over just the last five sessions before Ghatasthapana, the median return is plus 0.17% and the index fell in only ten of 21 years: a coin toss. The weakness belongs to the stretch about four weeks to one week before the festival, roughly the back half of Bhadra and the start of Asoj, where the median is minus 2.1% and declines show up in 13 of 21 years. Whatever drives the pattern acts early. By the time the tika shopping is visible in the streets, the market has usually done its falling. If households selling for festival cash were the cause, the final week would be the weakest. It is not.
The study tests two other windows and gets two other answers. The Navaratri sessions, from Ghatasthapana to the last trading day before the holiday closure, are strong: median return 1.56%, positive in 17 of 21 years. One reading is that traders buy back before a long closure rather than hold cash through ten days of spending. The recovery after the festival, the part of the folklore that promises the market comes back, is not there. Over the 20 sessions after reopening, the median return is exactly 0.0%, with the index rising in ten years and falling in eleven. The festival effect, it turns out, is a run-up effect plus a holiday-week effect. The post-festival recovery is the piece the folklore invented.
Which brings the story to 2026. Ghatasthapana falls on Sunday, October 11 this year (Merokalam), and under the Monday-to-Friday trading week the exchange adopted in April, the study's day zero is Friday, October 9. Counting back, the first 15 sessions of this year's run-up ran from September 9 to October 2, and the index rose 1.6%, from 2,545.40 to 2,587.25. The starting point is confirmed by daily market records (New Business Age reported the September 9 close), and the October 2 close is the Farsight Nepal market figure. Graded against every 15-session window this year, the run-up scores 0.68: better than an ordinary stretch, not just better than an ordinary Dashain. In the study's charts it sits above the 90th percentile of past run-ups at the same point. Only one earlier festival started more strongly, 2007 at 9.5%, and 2018 matched this year's 1.6%. Five sessions remain before day zero, running October 5 through 9. The historical median for those final five is close to flat. One caveat rides along: the index lost 42.55 points in the week ending October 2, so the run-up is strong measured from September 9, but the market is not exactly charging into the festival week.
The study is honest about its limits, and they deserve plain stating. Twenty-one observations is a small number. A pattern can be real and still be useless for predicting the next instance; the two statements are not in conflict, and confusing them is the second commonest mistake in reading seasonality. The placebo tests, which ran the same procedure on hundreds of windows where the festival cannot be the cause, found none as weak as the Dashain run-up, but they also turned up a second seasonal end: the market's strongest stretch sits around the fiscal-year turn in July. Single-month readings are noisy. And this year's exception fits the same logic as the rule: the folklore predicted a fall into Dashain, and the data predicted that a fall, if it came, would have come weeks ago. Neither happened.
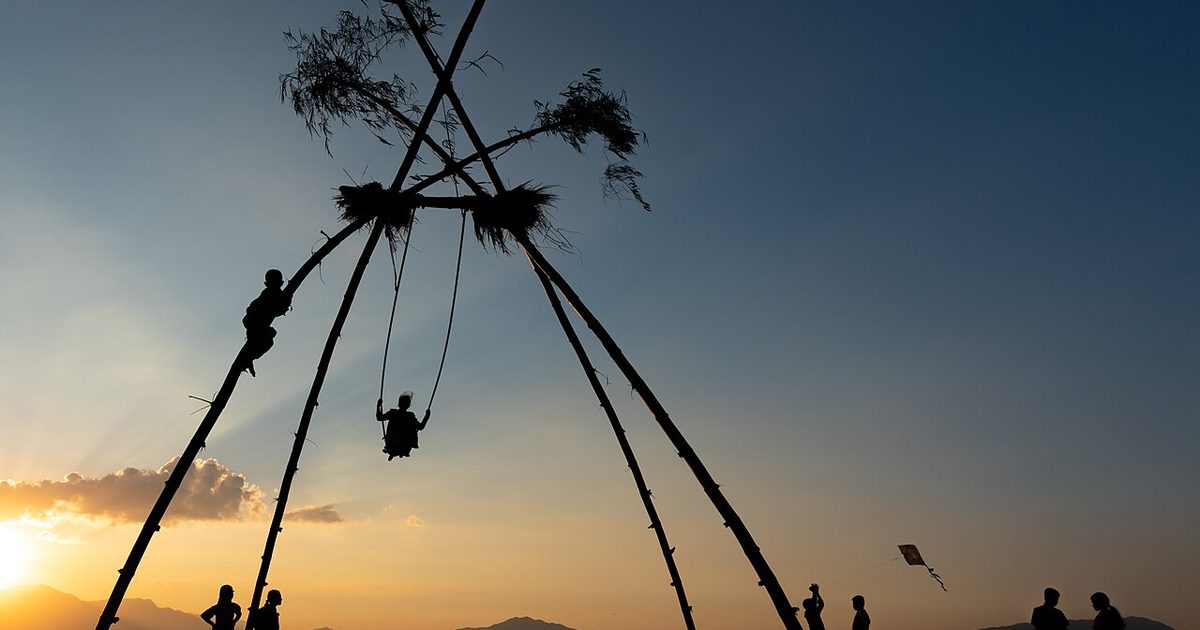
The kites are already up. For investors, the useful part of the study is not a trading signal but a habit: line the event up properly, count both the pattern and the failed explanation, and remember that 21 festivals can describe the shape of a season without saying what Friday will do. The weakness usually lands weeks before the festival. This year it never arrived. Five sessions remain to see whether the exception holds.
This article is published for research and education purposes only. It is not investment advice, and nothing here should be read as a recommendation to buy, sell, or hold any security. Figures cited reflect publicly reported information at the time of writing.